Before you start
What you need on your chart
Real volume.
Any stock works. For Nifty or Bank Nifty, use the futures chart: the index itself doesn't trade, so it has no order flow.
Yesterday's volume profile.
A session (daily) profile with the value area at 70%, so you can read yesterday's VAH, POC and VAL.
A footprint chart.
Also called an order flow chart (for example the Order Flow chart on Dhan). Every candle is split into two columns: what was sold in a hurry (left) and what was bought in a hurry (right), at each price.
Delta and CVD.
The delta under each candle is bought minus sold. Add a session CVD (cumulative volume delta) below the chart.
A 15-minute chart.
Every signal here is a 15-minute candle closing, not a wick.
Read the footprint
The one number at the top of the candle
Breakout
Next push
New high
640 → 140 → 12: each push higher gets less buying
The process
Four steps, in the order you'd do them live
Short side. Prices are an illustration; the shape of the trade is what repeats.
Example chart · 15 min
- 1
Mark yesterday's levels.
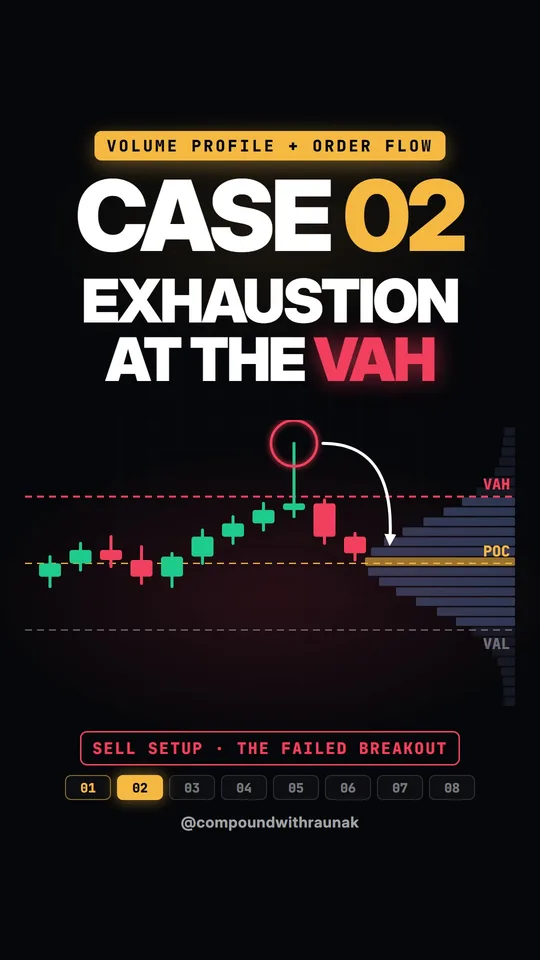
From yesterday's profile: VAH, POC and VAL. In the example: VAH 24,670, POC 24,590, VAL 24,510. Today you're watching the top: the VAH.
- 2
When price pushes above the VAH, look for exhaustion.
Most people see a breakout and buy. Open the footprint and ask: is there still real buying behind this move? On a real breakout the bought column keeps filling up with big numbers as price goes higher. Exhaustion is the opposite: every new push comes with smaller buying, and the print at the very top of the candle is tiny. In the example: 640 → 140 → just 12 bought at the top. This is a warning sign, not your entry.
- 3
Check the CVD.
The CVD is all the deltas added up through the day. If price makes a new high but the CVD makes a lower high, the move is running on empty. In the example, the new high (24,695) printed with a delta of −812: CVD 18,442 → 17,630.
- 4
The trigger, the stop, the target.
Sell when a candle's delta turns red and it closes back below the VAH (the example's trigger: delta −4,441, close 24,665). Everyone who bought the breakout is now trapped above, and their selling pushes price down faster. Stop just above the high of the failed breakout. First target: the POC. Reward at least 2x the risk.
Price makes a new high, but the CVD makes a lower high. Fewer people are buying on every push.
The example in numbers
Reward 2.1x the risk. The trade passes.
Sell
24,665
Stop
24,700
Target
24,590
Entry 24,665, stop 24,700 (just above the failed breakout's high at 24,695), risk 35 points. Target, the POC 24,590: 75 points away, 2.1x the risk, so the trade passes. If the POC had been closer than twice your risk, you'd skip it.
When not to trade it
Skip it when the buyers are still there
The breakout is real when the buying keeps getting bigger. Don't fight it.
The buying keeps getting bigger
as price goes higher
Each new push shows bigger numbers at the top of the bought column, not smaller. In the reel's skip example: 640, then 880, then 1,240.
The delta stays green
candle after candle
The buyers are still the ones in a hurry.
The CVD makes new highs
along with price
No divergence means no exhaustion. In the example the CVD kept climbing: 21,483, then 25,221.
Big news days
results, RBI policy, the Budget
Levels get run over when the whole market reprices. Sit those days out.
Less than 2x
to the first target
If the POC is too close for a 2x reward, skip it, however good the signals look.
Six mistakes that break this setup
Selling the first big breakout candle. Big buying on the breakout is what a real breakout looks like. Exhaustion shows up after, on the pushes that follow.
Selling just because price is at the VAH. The level tells you where to look. The shrinking buying and the CVD lower high are the reason to act.
Reading one cell. Compare the top of each push with the push before it, and check the delta, not a single number.
Using wicks. A wick back below the VAH is not a signal. Wait for the 15-minute close.
Stop in the wrong place. Too tight and normal noise takes you out; too wide and the trade fails the 2x check. Just above the failed breakout's high.
An index chart with no volume. Use Nifty or Bank Nifty futures for their order flow.
Practise before you put money on it
Use your platform's bar replay. Go back through 20 days on Nifty futures or a stock you follow, mark yesterday's VAH on each, and every time price pushes above it, run the four steps. Note which days showed exhaustion, which were real breakouts, and how each played out. Trust the setup because of what you saw on your own chart.
Keep this next to your screen
The checklist
Tick every box, or don't take the trade.
Before the open
At the value area high
The trade
Skip it if
0 of 12 ticked
The series
Volume Profile + Order Flow
CASE 01
Absorption at the VAL
CASE 02· YOU ARE HERE
Exhaustion at the VAH
CASE 03· COMING SOON
CVD divergence
CASE 04· COMING SOON
The real breakout
CASE 05· COMING SOON
Trapped traders
CASE 06· COMING SOON
Naked POC magnet
CASE 07· COMING SOON
Stacked imbalances
CASE 08· COMING SOON
Thin zones
Get the next case when it drops.
Follow @compoundwithraunakEducational only, not investment advice. The prices and volumes on this page are an illustration, not a real session. Trading involves risk of loss; size every position so a stop-out is a loss you can afford. Follow @compoundwithraunak for the next case.
Compound with Raunak is not a SEBI-registered investment adviser. All content published on this platform, including trade calls, research, and analysis, is for educational and informational purposes only. Nothing here constitutes investment advice or a recommendation to buy or sell any security. Readers should consult a qualified financial adviser before making investment decisions. Past performance is not indicative of future results.