ESSAY
The Forward Curve is Whispering $72.
30 April 2026
Yesterday the front-month Brent contract settled at $118.03 per barrel, the highest level since June 2022. Television anchors are reading out $200 oil forecasts. WhatsApp groups are circulating maps of the Strait of Hormuz. The Indian Basket is at $112.80 and the rupee is sliding. None of this is the actual story.
The actual story is buried in a column of numbers most retail investors never read. The Brent forward curve, all the way out to December 2030, is doing something the cash market is not. It is patiently pricing the end of this war. And it is telling you, in cold print, where crude will likely settle when the noise fades.
What follows is a stress test of that signal, the four structural pillars supporting it, the counterarguments worth taking seriously, and the practical read-through for Indian equity portfolios over the next eighteen months.
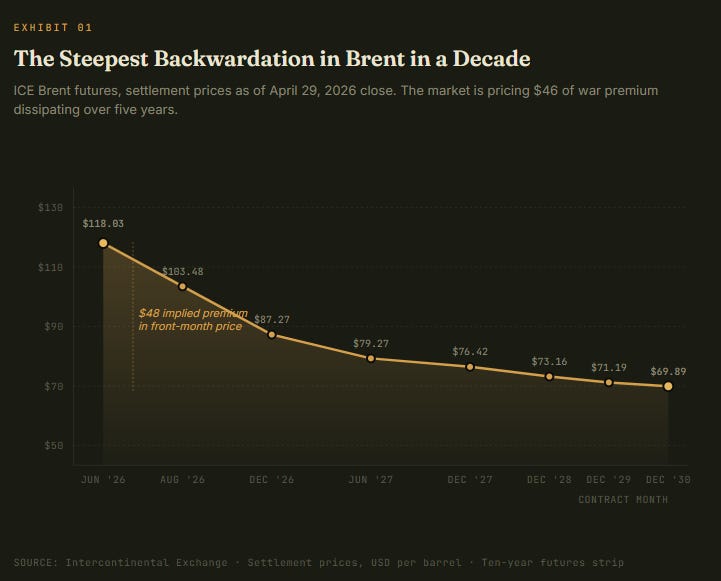
Read this chart slowly. The same market printing $118 today is selling December 2026 delivery at $87. It is selling December 2030 at $69.89. The implied judgement is that roughly $48 of today’s price is a temporary premium tied to the closure of the Strait of Hormuz, the US naval blockade of Iranian ports, and the absence of approximately 7.88 million barrels per day of OPEC supply that has been knocked out since the Iran war began.
A forward curve is not a forecast. It is the price at which buyers and sellers are willing to lock in delivery today. When that curve is this steeply backwardated, four things are usually true at once. Inventories are running low. Physical buyers are scrambling. Speculators are not interested in storing barrels because the curve does not pay them to. And the consensus view is that the disruption ends, on a known timetable, within the duration of the contracts.
The Dated Brent spot price is currently trading at a premium of more than $25 per barrel over the front-month futures contract, one of the most extreme physical-paper dislocations on record. Buyers are paying up violently for cargoes available right now, while contracts for delivery six months out are priced thirty-one dollars cheaper. That gap is the war.
PILLAR 01
The Iran-US Equation Will Eventually Resolve
The first pillar holding up the forward curve is a base-case assumption that the standoff over the Strait of Hormuz cannot persist indefinitely. The logic is symmetric and borderline mathematical.
The strait normally carries roughly 20% of global oil shipments. Iran controls passage. The US blockade controls Iranian export. Iran has offered to reopen the strait if Washington lifts the blockade and ends the war, with nuclear negotiations postponed to a later stage. Secretary Rubio called the offer unacceptable. Trump cancelled the planned Kushner-Witkoff trip to Islamabad on April 25 and stated publicly that the US “holds the cards.”
Yet the economic costs are accumulating on the American side faster than on the Iranian side. The University of Michigan consumer sentiment index has collapsed to 49.8, a fifty-year low. Pakistan’s Prime Minister announced that oil import costs are up 167% since the war began. European industrial output is contracting. The 2026 midterm calendar looms over every White House decision. Commonwealth Bank of Australia’s strategic note this week stated the position cleanly: the longer the strait remains closed, the higher the political cost of holding the blockade, raising the likelihood that one side backs down. Their base case is that the United States goes first.
The market is not pricing certainty of resolution. It is pricing the asymmetric distribution of who blinks. That asymmetry is what gives the curve its shape.
PILLAR 02
The UAE Has Strategically Defected from OPEC
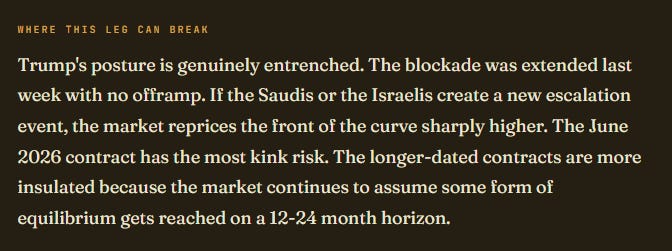
On April 28 the United Arab Emirates announced that it will exit OPEC and OPEC+ effective May 1, after fifty-nine years of membership. This is the single most important supply-side development of the year, and it is being underplayed by the financial press.
The UAE was OPEC’s third-largest producer behind Saudi Arabia and Iraq. Its quota under the OPEC+ framework was 3.2 million barrels per day. Its actual sustainable production capacity is 4.85 million barrels per day. Its 2027 capacity target is 5.0 million barrels per day. For years the country has been forced to pump roughly 30% below capacity to maintain Saudi-led price discipline. That ends now.
The strategic logic of the UAE’s exit was articulated most cleanly by Kingsmill Bond, energy strategist at Ember Future, in an Al Jazeera interview this week. Bond’s framing: the UAE is preparing for a world after the Iran war where oil demand is in structural decline, where OPEC’s coordinating power is weaker, and where the rational play is to maximise volume sold before energy markets shift permanently away from fossil fuels. This is the opposite of Saudi Arabia’s strategy of holding the line on production discipline to keep prices high.
Two countries that for years sat next to each other in OPEC meetings have now publicly committed to opposite strategies. UAE wants the volume. Saudi wants the price. When that split happens inside any cartel, the cartel weakens. Lipow Oil Associates this week flagged Nigeria as a flight risk too, citing the ramp-up of the Dangote refinery, which lets Nigeria capture more of its own crude as fuel margin and reduces its incentive to abide by quotas. Venezuela, with output recovering faster than expected and a more US-friendly political environment emerging post-Maduro, is the third candidate.
The UAE wants the volume. Saudi wants the price. When that split happens inside a cartel, the cartel weakens.
Even before the UAE’s announcement, eight key OPEC+ producers, including Saudi Arabia and Russia, had agreed on April 5 to begin easing voluntary output cuts, gradually returning roughly 206,000 barrels per day to the market in May. Saudi Arabia, separately, is preparing to cut its June official selling prices to Asia sharply after a record $19.50 premium in the prior month. The internal pressure within OPEC+ to defect or to ease cuts is now visible from multiple directions at once.
PILLAR 03
Every Comparable Conflict Spike Has Mean Reverted
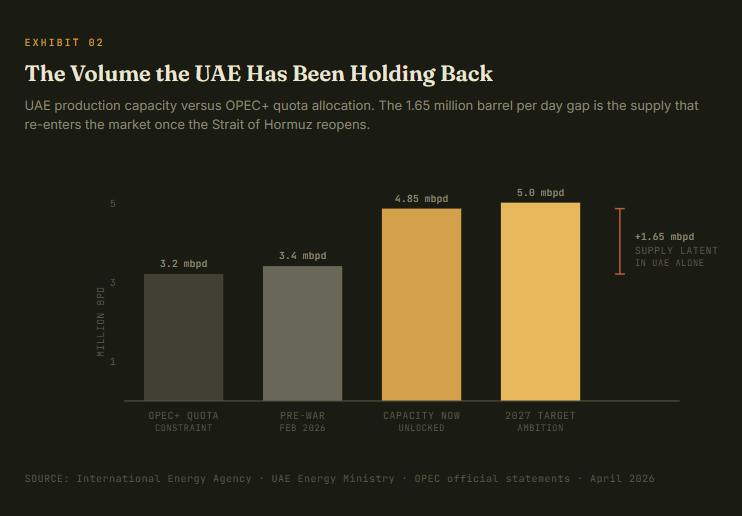
The third pillar is the historical pattern. Geopolitical oil shocks tend to be sharp and short. The market has fifty years of data on this question.
Five episodes. Five reversions. The 1990 Iraq invasion of Kuwait pushed prices from $15 to $42 in two months, and Operation Desert Storm restored supply within five months. Saudi Arabia pumping to offset losses did most of the work. The 2011 Libyan civil war put Brent at $127, which lasted a year before mean reverting. The 2014 OPEC price war was different in cause but identical in resolution path, with crude crashing 77% to $26. The 2022 Russia-Ukraine shock printed $128 in March 2022 and was back at $72 by mid-2023.
The pattern is not subtle. The reasons are mechanical. Geopolitical shocks remove a slice of supply, prices spike, demand destruction kicks in at the top of the curve, alternative producers ramp, and the marginal cost of supply reasserts itself. The variable is timing, not direction.
The objection worth taking seriously is that 2014 reverted to $26 while 2022 reverted to $72. The reversion target depends on what the marginal cost of supply looks like when the dust settles, and that has shifted higher over the past decade as US shale economics have become more disciplined. Standard Chartered’s house view as of April 22 is that $95 per barrel is the new equilibrium for crude. Goldman Sachs raised forecasts again last week. Wall Street is not unanimous in believing the long-end of the curve.
PILLAR 04
The Energy Transition Endgame is Pricing In
The fourth and most under-discussed pillar is what the very long end of the curve, December 2030 at $69.89, is actually telling you. That is the market pricing peak oil demand.
Three data points from this week’s news flow alone: IEA Executive Director Fatih Birol stated that the Iran war will permanently reduce future oil demand by accelerating substitution toward renewables. China’s LNG imports collapsed to a six-year low. India’s renewable capacity additions cut fossil fuel power use in 2025 outright, even with record summer demand. Pakistan’s PM said oil import costs are up 167% since the war began, the kind of pressure that forces structural energy policy responses.
This is the world the UAE is preparing for. It is also the world the long end of the Brent curve is pricing. December 2030 at $70 is not a forecast that nothing happens for five years. It is a forecast that whatever happens, the structural marginal demand pull on oil is weaker in 2030 than it is in 2026.
Where the Bears Could Be Wrong
The discipline of the framework requires giving the strongest counter-arguments their hearing. There are four worth weighing.
One. The Iran-US negotiation is not progressing. Rubio publicly rejected the Hormuz-first proposal. Trump cancelled the envoy trip. Iran is stockpiling tankers outside the strait. If the standoff drags into Q3 2026, the front of the curve recalibrates. The June-August 2026 spread of $14.55 is too aggressive for that scenario.
Two. Saudi Arabia’s response to UAE’s exit could be retaliatory rather than accommodative. If Riyadh decides to reassert OPEC discipline through a price war, near-term volatility increases dramatically. The 2014 precedent is the one to watch. That said, with Saudi already cutting June Asia OSPs after the $19.50 premium peak, the early signal is accommodative.
Three. US shale rigs are scaling back, not up. The current rig count rose modestly this week but remains well below 2022 peaks. If supply growth from non-OPEC sources is slower than the curve assumes, the reversion target shifts higher. StanChart’s $95 equilibrium thesis sits in this camp.
Four. Goldman Sachs raised forecasts. The Wall Street strategist consensus is more bullish than the futures curve implies, which means there is a real chance the curve moves up to meet sell-side targets rather than the spot price coming down to meet curve targets.
Each of these arguments shifts the magnitude or timing of reversion. None of them invalidates the direction. The bears are debating whether Brent settles at $72 or $95. The bulls trying to defend $120 forever are arguing against the entire structure of the curve and fifty years of historical precedent.
The Probability-Weighted View
Combining the four pillars and the four counterarguments, the probability-weighted scenario picture for Brent over the next twelve months looks like this.
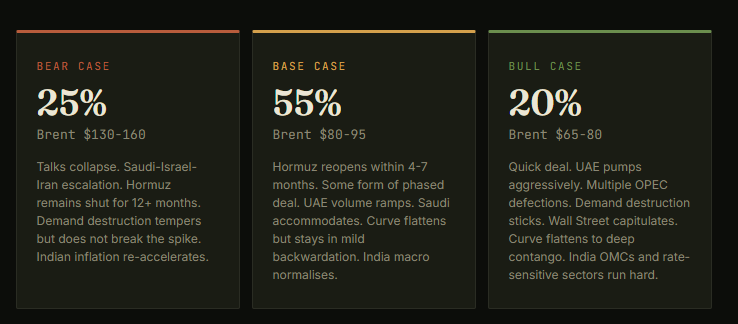
The probability-weighted twelve-month price comes out to roughly $90 per barrel. That sits comfortably below the front-month at $118 and slightly above the December 2026 contract at $87. The curve is doing approximately the right thing.
The India Read-Through
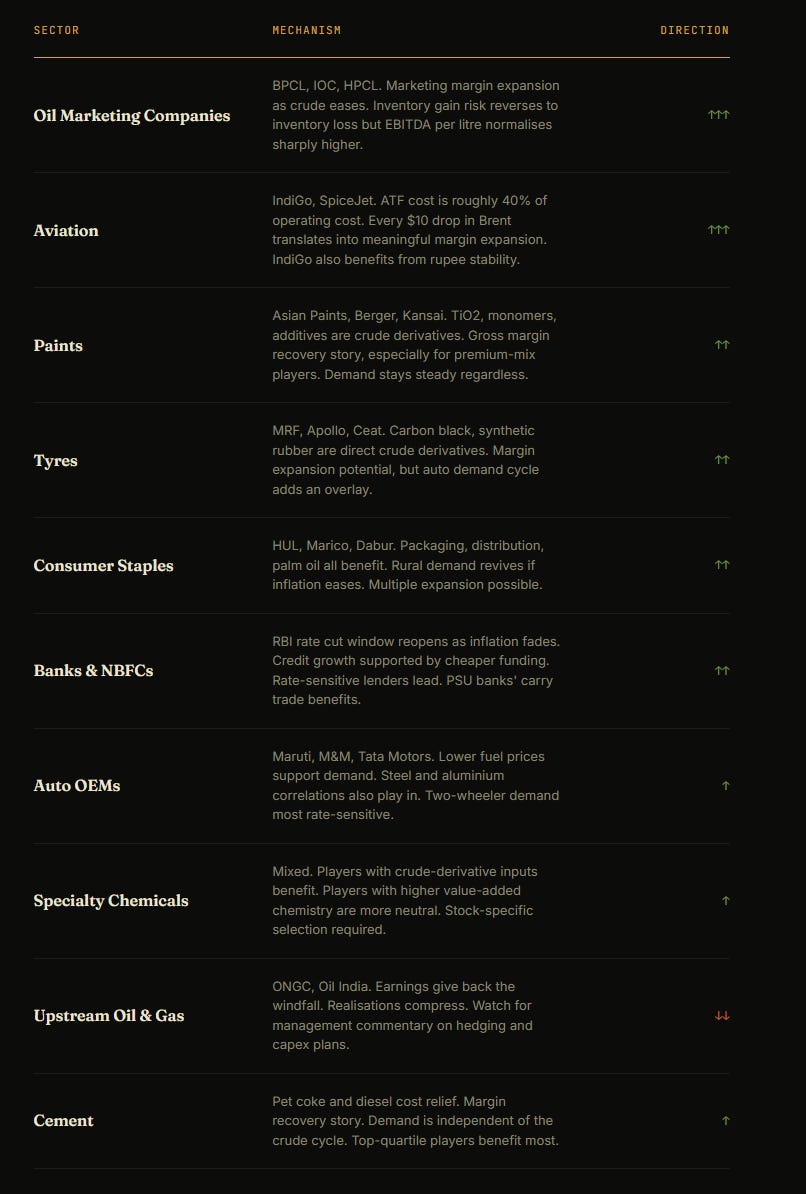
For an Indian portfolio with a three-to-five-year horizon, the practical question is what to own as this base case plays out. India is the third-largest oil importer globally. Crude moves leave fingerprints across nearly every sector of the index.
The key macro consequences of a Brent reversion to the $85-95 zone over the next twelve months are: the current account deficit narrows sharply, the rupee stabilises around 84-85, headline inflation fades back toward the RBI target band, and the central bank gets back the room to cut rates that has been frozen since the war began. That combination is historically among the most powerful tailwinds for Indian financials, consumption, and capex-leveraged businesses.
The Sectoral Map
The Underrated Plays
Beyond the obvious sector calls, three less-discussed themes deserve attention.
Logistics and shipping. Bunker fuel is roughly 50% of operating costs for shipping operators. Container lines, port operators, and dry-bulk shippers benefit asymmetrically from crude reversion. Adani Ports and several shipping-adjacent names trade on a lag to the crude cycle.
City gas distribution. CGD names like Indraprastha Gas, Mahanagar Gas have struggled with LNG cost pressure. As global LNG reprices alongside crude, their input cost normalises. CGD also has an underappreciated tailwind from the structural shift away from auto fuels in metro India.
Capex and infrastructure. If the RBI gets room to cut, the entire infrastructure and capex theme reignites. NBFCs lending into the segment, EPC contractors, capital goods names. The same names that have been gasping under the higher-rate regime get oxygen back.
What Not to Do
The most common mistake retail investors make in a setup like this is to chase the upstream beneficiaries on the way up. ONGC, Oil India, Reliance’s E&P segment, all of them are bid up while crude is at $120. By the time the curve normalises, those positions become the source of underperformance. The trade is to fade the strength in upstream during the war and accumulate the consumers of crude at the same time. The forward curve is doing this calculation for you. Read it.
Position and Risk
A few practical guardrails for sizing exposure to this thesis.
First, the timing of front-month resolution is the single largest source of dispersion in outcomes. Short-dated equity exposure (options, leveraged ETFs) is a poor way to express this view. Owning the underlying businesses with three-to-five-year horizons captures the same thesis at a fraction of the path-dependence risk.
Second, the bear case is real and deserves a hedge. A 25% probability of Brent at $130-160 is not negligible. Position sizing in OMCs, paints, and aviation should leave room for a six-month period of further crude strength before the reversion sets in. Quality of business over timing of trade.
Third, the energy transition pillar is a five-year story, not a six-month story. The December 2030 contract at $70 reflects a structural shift, but most equity expression of this view trades on quarterly earnings cadence. Pace your accumulation.
Fourth, watch the data points that would invalidate the thesis. A real-time invalidation list: Saudi reasserts OPEC discipline through a coordinated cut; another major producer (Israel-Iran direct exchange, attack on Saudi infrastructure) creates a fresh supply shock; the December 2026 Brent contract rises above $100 (which would mean the curve itself is repricing the war as longer-duration). Any of these would force a reassessment.
The Curve Has Always Been Smarter Than the Headlines
The Brent forward curve is not a forecast. It is the collective wisdom of every refiner, every airline, every commodity trader, every sovereign wealth fund, and every speculator with capital at risk, all reaching the same conclusion through different routes. It is the most expensively-derived signal in the energy market. And it is currently shaped like a slide, falling forty-eight dollars from front-month to five years out.
That signal can be wrong. Curves have been wrong before. But the burden of proof sits with anyone who wants to argue against it, and the historical record offers very few cases where conflict-driven crude spikes failed to mean revert. The structural forces this time, with UAE defection, OPEC fatigue, energy transition acceleration, and demand destruction at $120 already showing up in the data, all reinforce rather than contradict the curve.
The headlines will keep shouting $120 for as long as the war commands attention. The curve will keep whispering $72. One of them is doing math. The other is selling fear.
Position accordingly.
DISCLOSURE
This article is published for informational and educational purposes only. It does not constitute investment advice, an offer to buy or sell securities, or a recommendation to take any specific action. The author is registered as a research analyst under SEBI regulations only to the extent disclosed in his public profile. Companies and securities mentioned are illustrative of the macro and sectoral thesis discussed and are not investment recommendations. The author or his immediate family may hold positions in some of the securities discussed. Readers should conduct their own due diligence or consult a registered investment advisor before making any investment decision. Past performance is not indicative of future results. Investing in equities involves substantial risk including the risk of capital loss.
WANT MORE LIKE THIS?
Join the Inner Circle for weekly deep-dives and live trade calls.
Apply for accessCompound with Raunak is not a SEBI-registered investment adviser. All content published on this platform, including trade calls, research, and analysis, is for educational and informational purposes only. Nothing here constitutes investment advice or a recommendation to buy or sell any security. Readers should consult a qualified financial adviser before making investment decisions. Past performance is not indicative of future results.