ESSAY
The Peace Trap: Why I’m Fading the Geopolitical Relief Rally
25 March 2026
The last couple of days have been good in the markets, the Nifty indices are pushing up, Brent crude dipped below $100 a barrel, and if you only read the headlines, you’d think the geopolitical storm has finally passed.
The catalyst for this sudden sigh of relief? News broke that President Trump delivered a 15-point peace proposal to Tehran, sparking rumors that the worst of “Operation Epic Fury” was behind us.
But as I sit here looking at the raw data, both the geopolitical realities and the technical market structures, I am still not confident of all this. I am deeply skeptical of this rally. This doesn’t look like a structural recovery; it looks like a textbook dead cat bounce. The market is completely mispricing the reality on the ground, trading on blind hope rather than cold fundamentals.
Let me break down exactly why I am not buying this dip.
The Impossible Macro Trade
Think of geopolitics like a market transaction. For any deal to go through, the buyer and the seller have to eventually agree on a price. Right now, the “bid-ask spread” on this peace agreement is infinitely wide.
On one side, the U.S. is asking for the moon: total dismantling of Iran’s nuclear capabilities and the immediate reopening of the Strait of Hormuz. On the flip side, Iran isn’t offering concessions. Through backchannels, they are demanding war reparations, the removal of all U.S. military bases in the Gulf, and the right to collect tolls over the Strait of Hormuz.
You don’t bridge a gap that wide with a simple 30-day ceasefire. The peace deal, for all practical purposes, is a ghost.
So why did the U.S. just move roughly 5,000 additional troops right to Iran’s doorstep? They aren’t an invasion force meant to conquer a mountainous nation of 90 million people. These are elements of the 31st and 11th Marine Expeditionary Units (MEUs), which are elite, forward-deployed amphibious assault teams.
Their target isn’t Tehran. Their target is the chokepoint. With the Strait of Hormuz suffocating the global energy supply chain, these Marines give the U.S. the immediate tactical ability to physically force that waterway open. They are positioned for a targeted, forceful escalation, not a peaceful pullback. Although, this could be a suicide mission for these soldiers.
The Technical Trap: The Illusion of Recovery
But you don’t just have to look at the Middle East to see the trap. The charts are telling the exact same story.
When you look at the recent price action on the Nifty 50 and Nifty 500, it’s easy to get lured in. The market has managed to close above the short-term 10-day moving average (DMA) on both the daily and 75-minute timeframes. To a retail trader, those big green daily candles look like the start of a new bull run.
But let’s zoom out and look at the actual market structure.
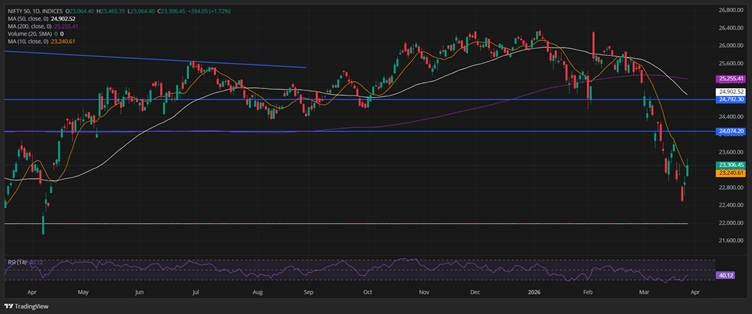
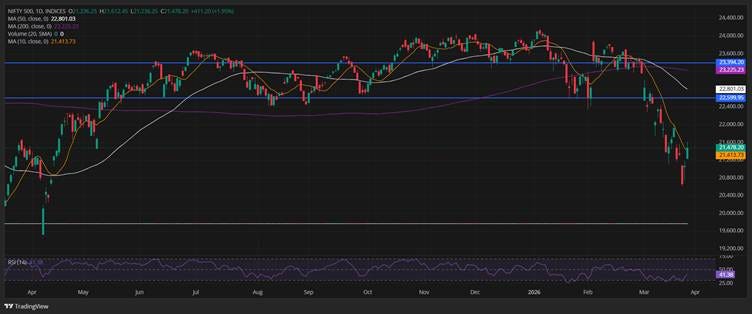
The structural damage on these daily charts is glaring. Yes, the price has peeked above the 10-DMA, but look at where we are relative to the heavy hitters. We are trading significantly below the 50-day and 200-day moving averages. Furthermore, the 50-day MA has sharply crossed below the 200-day MA, a classic “Death Cross.” The primary trend is aggressively down.
What we are witnessing is mean reversion, not a reversal. Over the last few weeks, the index fell in a vertical, uninterrupted line. When a market drops that fast, it gets overextended, like a rubber band stretched too far. The Daily RSI hit deep oversold territory and is now just bouncing back to the 40-41 range. This is the rubber band snapping back to give the market room to breathe, not a structural bottom.
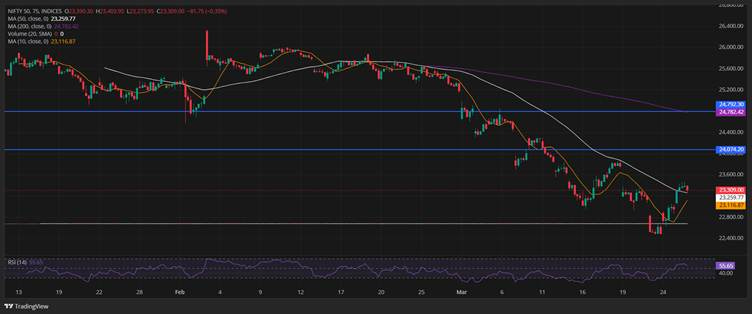
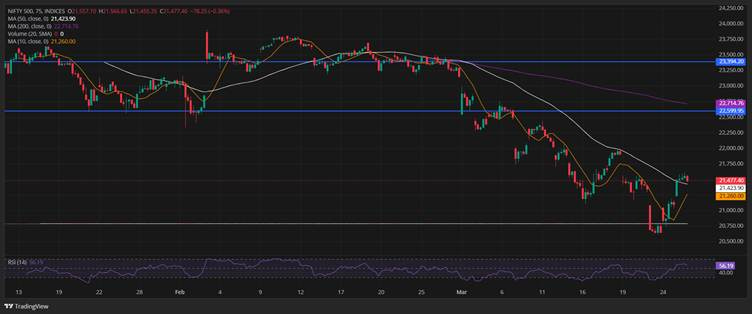
The intraday 75-minute charts reveal the exact mechanics of this trap. The indices have managed to cross above the 50-period MA, which is giving traders that feeling of hope. But notice the overhead supply.
Every time the market tries to push higher from here, it is going to hit a wall of trapped buyers looking to exit at breakeven. Look at those horizontal resistance lines on the Nifty 50 (around 24,074 and 24,792). Before we can even begin to call this a trend reversal, the index has to chew through massive overhead supply and reclaim the 200-period MA, which is still miles away.
The Bottom Line
When I synthesize the macro data with the technical charts, the picture is incredibly clear.
When you have a devastating structural breakdown, the first violent move up is almost always a trap fueled by short-covering and dip-buyers hoping to catch the absolute bottom. Crossing the 10-day MA is the bait.
The market has priced in a diplomatic miracle that has almost zero probability of succeeding, while the charts are perfectly set up for a bull trap just as the broader, heavier downtrend waits to push prices back down. We are not watching the beginning of peace; we are likely watching a mechanical market breather right before the physical clearing of the Strait of Hormuz.
I will not be trading on headlines until I see the reality on the ground actually match the optimistic rhetoric.
Disclaimer: I am a NISM-certified research analyst, but the views and analysis presented in this article are entirely my own and are for educational and informational purposes only. This is not a direct recommendation to buy, sell, or hold any securities or execute any specific trades. Geopolitical events and financial markets are highly unpredictable, and trading involves significant risk. Please conduct your own due diligence and consult with a registered financial advisor before making any investment decisions.
WANT MORE LIKE THIS?
Join the Inner Circle for weekly deep-dives and live trade calls.
Apply for accessCompound with Raunak is not a SEBI-registered investment adviser. All content published on this platform, including trade calls, research, and analysis, is for educational and informational purposes only. Nothing here constitutes investment advice or a recommendation to buy or sell any security. Readers should consult a qualified financial adviser before making investment decisions. Past performance is not indicative of future results.